Keeping up with the ever-evolving machine learning landscape can be difficult. It seems that every month new modelling software is released, or a tech company open sources a machine learning algorithm. In the context of the SAP technology stack, we want to understand the landscape of the machine learning models provided by SAP Business Objects Predictive Analytics (SAP PA), specifically the Expert Analytics component, which SAP presents as their “ultimate” modelling tool. Since SAP systems are ubiquitous in large corporate back ends, choosing the right tool and algorithm to use for a specific task is vital.
In a previous blog, we carried out an evaluation of the data transformation process using the Automated Analytics component of SAP PA. Describing the creation of a model is the next step in the data science process, and Expert Analytics does provide a number of options for undertaking this. This article will consider the supervised learning models provided in Expert Analytics and Automated Analytics. We will explore how the available modelling regimes compare in versatility and ease of use, and by using the AdventureWorks data set we introduced previously, we can measure their predictive power.
EXPERT ANALYTICS
In the previous blog post, we described Automated Analytics and explored capabilities as it relates to preparing and transforming data. This article will introduce the complementary component, Expert Analytics, which is positioned by SAP as a more advanced modelling tool to cater for a more finely-tuned modelling process. Expert Analytics is a drag and drop style analytics workbench where you can “build predictive models to discover hidden insights and relationships in your data”. It has access to a few modelling engines, which we’ll discuss below, while articulating which modelling engine is most appropriate to use in which situation. Expert Analytics has access to a few modelling engines, and we will try and articulate which modelling engine is most appropriate to use in which situation. More information is available in this SAP blog post.
We are only considering the use of Expert Analytics when connected to a HANA data source, as opposed to other options, such as local CSV data. This affects the available algorithms and models. When connecting to a HANA data source, all of the algorithms are HANA versions that run either on the HANA server or on the connected R server. For a CSV data source, there is a more limited range of available algorithms that run locally on the client machine, but this does include R algorithms that run on an installed R instance.
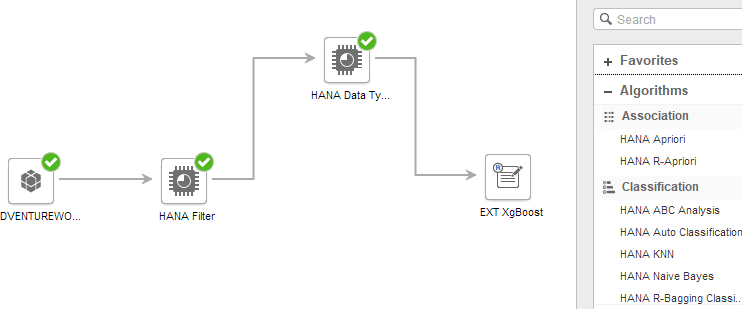
The screengrab below shows the “Predict” screen in Expert Analytics, where the modelling pipeline is built. The data source at the far left is run through a filter, a data type transformer and then into a custom R extension. This means that quite complicated pipelines can be achieved, with the availability to run multiple models with comparisons.

MODELLING CAPABILITY OVERVIEW
The SAP Data Science space draws modelling tools and algorithms from four primary areas: The Predictive Analysis Library (PAL) and the Automated Predictive Library (APL), which both run in-memory on the HANA server; the Automated Analytics/KXEN engine, which runs locally on the client or on a separate analytics server; and the R language and associated packages, which is supported on the SAP platform as an R server connected to the HANA server. We also explore the H2O machine learning engine which is accessible via R. We have provided a brief overview for each below.
APL / KXEN.
The KXEN engine is what sits at the core of the Automated Analytics’ modelling capability. As we have discussed, you will find the option to utilise either the Expert Analytics or Automated Analytics components through the SAP Predictive Analytics tool. However, the KXEN engine behind Automated Analytics has also been deployed as a native C++ implementation running directly in SAP HANA (termed the Automated Predictive Library, or APL) making this available as an option through Expert Analytics itself. It covers a range of supervised and unsupervised learning problems as well as time series analysis, association modelling and social network analysis. The engine has been designed to yield a reasonable result without requiring manual tuning, and to that end offers little in the way of tuning parameters. The default performance of the engine for classification tasks can be reasonably good compared with state of the art packages (e.g. H2O) as we show later in this post.
Since the KXEN engine has been reworked to run inside the HANA data base, it could offer advantages for large datasets by executing in-memory on the server, although care should be taken running machine learning algorithms on a production database. APL has some overlap with PAL routines, but is intended to automate much of the work associated with modelling (such as choosing the appropriate algorithm and parameters), and SAP considers these two offerings complementary.
PAL
PAL (Predictive Analytics Library) is a statistical and modelling library that runs directly on the HANA server. Using it within the SQL environment is a somewhat manual process; there is a lot of boilerplate code to set up procedures, create control tables, results tables, etc. However, we note the most recent release of HANA has simplified much of this. Despite the name, many of the algorithms in PAL could be described more as diagnostic rather than predictive. There are functions such as Confusion Matrix, AUC, and TTest that are intended to test the accuracy of a model once it has already been trained.
In its Expert Analytics implementation, there are a handful of models and parameters that the user may choose from. In this sense, it could be considered somewhat analogous to the R modules which we discuss next. The complete PAL functionality is available only in the HANA environment and Expert Analytics unfortunately provides only a limited number of supervised machine learning algorithms from PAL.
These include:
Support Vector Machine
Logistic Regression
Naive Bayes
This is a little frustrating because we know there are neural network, random forests and boosters available. In any case, we will find later that the performance of the more automated offerings (KXEN/APL) are reasonable, and if even better performance is required, making use of a custom R script is an almost ideal solution.
Built-in R modules
Expert Analytics provides access to a number of R algorithms as modules, which are invoked on an R server connected through HANA. The algorithms (and their libraries) included for supervised learning are:
Bagging Classifier (adaBoost)
Boosting Classifier (adaBoost)
Random Forest Classifier (randomforest)
Multiple Linear Regression (stats)
Random Forest Regression (randomforest)
CNR Tree (rpart)
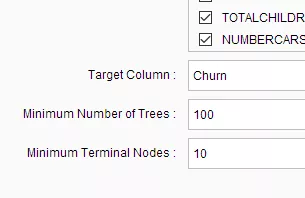
The benefit of this is that no knowledge of R is required to use these modules, and there are a few key parameters that can be adjusted to tune the model. The default analysis of results includes a confusion matrix and variable importance measures, although using the Model Statistics APL module allows one to access AUC.


Custom R extensions
In addition to the R modules which are easy to use by simply dragging and dropping them onto the Designer workspace, there also exists an R scripting capability within Expert Analytics. We should distinguish here between R scripting and R programming. Since R is an interactive language, and an environment for interpreting that language, the idea of scripting is usually a foreign one to the R user. The purpose of R scripting here is to take working R code, convert it to a function, and run it in the SAP analytics stack. All that is required is that the R code accepts input data, which gets passed to it from the previous node on the pipeline in the Designer.
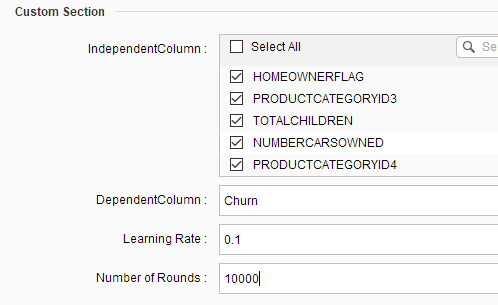
This contrasts with the built-in R modules where parameters are hard coded; in a custom R script in Expert Analytics the code is manually constructed, and the author can specify the input controls that will be made available in the GUI interface. R’s powerful visualisation capabilities can be specified as an output; this allows one to “visualise, discover and share hidden insights”.
The screengrab below indicates how custom model parameters can be specified (“Learning Rate” and “Number of Rounds”):

This tool is obviously focused on experienced data scientists and R users that are comfortable with writing their own code, and may in fact prefer to be in control of the modelling and evaluation process. The tool also makes available a much larger range of modelling and statistical capabilities by leveraging the entire R ecosystem.
H2O
H2O is a machine learning platform that runs in a variety of contexts and supports many common data sources. It can be run locally, on servers, clusters, etc., and can scale up to large data sets. It is not part of the SAP ecosystem per se, but it is accessible via R.
In a previous blog, we discussed how H2O can be called from a HANA environment using the R scripting functionality. We can invoke H2O in a similar fashion here. Using the R extension feature in Expert Analytics, we can call an H2O routine to train a model, evaluate its performance and apply the model to new data. H2O is marketed as a big data machine learning platform, so it is primarily focused on the modelling component of a data science workflow. We note though that in recent years it has begun providing data transformation capability at scale. It can be run on the R server connected to HANA, or also as a distributed cluster of nodes, when more performance is required.
SUMMARY
The points we have discussed above have been conveniently summarised in the table below and we have also included accuracy metrics that we derived using the AdventureWorks scenario introduced in previous posts. We go into some detail about this below.
| APL(KXEN) | PAL | R-Module | R-Extension | H2O | |
|---|---|---|---|---|---|
| Large Model Variety | No | No | No | Yes | No |
| Difficulty/Learning curve | Easy | Hard | Hard | Easy | Hard |
| Accuracy | Acceptable | Poor | Good | Good | Most Accurate |
CASE STUDY: ADVENTUREWORKS
Now that we have discussed usability and functionality of the different modelling regimes available in Expert Analytics, we will discuss the accuracy of some of the models themselves. We will also recommend in which scenarios these algorithms might be best used.
There are many metrics to describe the accuracy of a predictive model, and it is important to select one that is appropriate for the problem at hand. This might be overall classification accuracy, per-class classification accuracy, or other derived metrics such as precision, recall, F1, etc. For the purposes of this discussion, we have decided to use the Receiver Operator Characteristic (ROC) curve and the associated Area Under the Curve (AUC) metric as a means of comparing the performance of different models. These metrics are convenient as they are insensitive to changes in the class distribution and hence represent intrinsic performance characteristics of the model, rather than specific details about how the dataset has been partitioned in the evaluation process.
The factors that influence model performance include:
the quality and extent of the data fed in;
the manner in which predictive features are extracted from the data; and
the choice of model (and model parameters) that are used.
Common wisdom in the field has it that point (2), i.e. data transformation and feature engineering, is the place where most effort should be expended to achieve the best improvements in model performance. In the previous blog post, we have already looked at how different products and tools in this space can assist with this step. For the present post, we assume this step has already been achieved, and we focus on point (3), that is, the models available for use in different offerings and how their performance compares.
We will evaluate model performance for the AdventureWorks scenario discussed in previous posts, that is, for the problem of predicting whether or not a given customer of the fictional cycling parts wholesaler will make another purchase within a given horizon, on the basis of their previous purchasing history and demographic information. The models that will be used directly are: the PAL Logistic Regression algorithm, the HANA R-Boosting module, the HANA R Sripting functionality with XgBoost, and the Gradient Boosting Machine (GBM) library in H2O. We also look at the KXEN engine of SAP Automated Analytics which can be called in Expert Analytics as an APL model, which is an automatically tuned ridge regression model.
We have made sure that all models are trained on the same portion of the data and then tested on a different partition; this is standard practice and ensures that we do not report overly optimistic results due to overfitting.
The figure below shows a comparison of the ROC curves amongst the various models tested. The technical details of the ROC curve are beyond the scope of this post, but in the simplest terms, a model performs “better” when it encloses more area beneath, or similarly, if it is “more to the left and above” than other curves. From the graph, we can see that the R-Adaboost / H2O / XgBoost models are the best, although they are tracked quite closely by the KXEN model. We discuss these in more detail below.
| Key | Model | AUC |
|---|---|---|
| H2O-GBM | H2O (Gradient Booster) | 0.9148 |
| KXEN | APL (KXEN) | 0.8621 |
| ADA | R module (ADABOOST) | 0.8944 |
| XGBOOST | R extension (XgBoost) | 0.9056 |
| PAL-LOGISTR | PAL module (Logistic Regression) | 0.6482 |
MODEL EVALUATION
APL (KXEN)
We were surprised with the accuracy of KXEN, falling just short of the other algorithms. It does appear that KXEN does some good work behind the scenes to “automatically” produce a good model. However, if further performance is sought, there is not much that can be done with the KXEN engine in Automated Analytics. Increasing the polynomial order to 2 (which the documentation advises should not be necessary) doesn’t help, in fact in this case it slightly decreases the AUC. This is where Expert Analytics comes in, as it is presented by SAP as offering the finer, “expert” control over the whole process. For us it means having a wider selection of models to choose from.
If one did not wish to engage in model tuning and selection, we would recommend sticking with these routines. As described below, it should be used alongside the R modules.
PAL
For anyone who has used the PAL functionality in HANA, they will find the Expert Analytics implementation greatly simplified. Hundreds of lines of code are now replaced with just a few mouse clicks. However, we found the improvement in the usage of the PAL functions didn’t extend into their accuracy.
We used the PAL logistic regression function and found it performed the poorest out of all the classifiers. We account for this by its implementation rather than the algorithm itself, which in other platforms performs reasonable well. Specifically, the documentation states that in PAL string types are permitted as independent variables, however in Expert Analytics they were not accessible. We also noted that multiclass logistic regression was not available; although it didn’t affect our results here, it is a feature we would like to see, and it is available in PAL from the HANA environment.
The only scenario in which we could see this functionality being used is when a specific PAL algorithm is migrated from the HANA environment to the Predictive Analytics environment. However, considering the shortcomings we have described, we wouldn’t recommend it.
R Modules
The R modules were altogether very straightforward to use; they provide a way to R without knowing any coding and you don’t need to be an expert to use this part of Expert Analytics. We strongly recommend that the few parameters available be adjusted from the defaults; using the R-boosting algorithm from the ADABOOST library, we observed a significant jump in model accuracy simply by increasing the number of trees.
As discussed above, there are only a few libraries available for regression and classification. We would like to see the XgBoost model made available; we would like to see it so much that we built our own module to access it using the R scripting functionality described below.
Despite our misgivings about the particular model being invoked in the R module, we could see this being employed in similar scenarios to the APL modules.It is an alternative that’s just as simple, and we would recommend to use them both and see which one works best.
R Scripting in Expert Analytics
We were pleasantly surprised by the functionality and versatility of the R scripting feature; it technically has access to all of R’s rich visualisation capability and all the advanced libraries. However, one does need to possess a reasonable grasp of the R language to take advantage of this. We are surprised that SAP don’t market this feature more; for a data scientist proficient in R, it’s quite straight forward to understand the tool and implement an R based model.
There are two scenarios in which we see this functionality being used: the first is when a very specific statistical model is required for a problem, and is not otherwise available outside of the R environment. By migrating the model into Expert Analytics, an end user can schedule and support the model like any other process used in that environment. Expert Analytics does not present an ideal development environment, but it is straightforward to develop the code within R and then copy it over to Expert Analytics when it is ready.
The second use case in which the R-scripting capability may be useful is to increase the accuracy of a model. This is of value where the stakes are high, such as assessing lending risk where one bad loan could equate to a write-off of hundreds of thousands of dollars. We decided to test this out using some specialised machine learning algorithms, to see how much of an improvement we could get over the R modules discussed above. Followers of Kaggle competitions will be familiar with the popular XgBoost algorithm; we decided to write an R script to implement this, and it does indeed render a small improvement in accuracy.
H2O
The H2O model gave the highest AUC score, although by only a small margin. In terms of usability, it’s essentially the same process as creating an R extension above. The biggest downside is the relative lack of algorithm; only a handful are available and these are largely supervised and unsupervised learning algorithms. However, this should cover most of what a data scientist needs.
The context in which one would use H2O above any other option is when the data set is large; H2O offers an extendable parallelised in-memory analytical engine.
CONCLUSION
We have described our experience using SAP Predictive Analytics in the context of predicting churn in a realistic data set. We have explored the various modelling frameworks available in terms of ease of use, model availability and predictive power. With the exception of the PAL implementation of logistic regression, the various modelling regimes were comparable in terms of accuracy. They are mainly differentiated by how easy or difficult they are to use, and the range of models available to them. Based on this, we were able to make some recommendations as to which scenarios they might be best employed in (see above). The trade-off between expediency and accuracy could largely be offset by tuning the model parameters available in the modules. For specialised models, or extreme accuracy, there is the option to use R extensions.
Although the workflow will not be what a data scientist is used to, it does allow their work to be incorporated into the SAP stack, and the mature business processes that typically accompany it. We will have more to say on this in our next blog about the production process using Predictive Analytics
