Created by Dr Michael Plazzer, Data Scientist – Ignite Data Solutions
There are plenty of articles discussing the value data scientists can bring to a company, and there are a few discussing how they are often wasted. In this article, I will try to quantify the value of having your platforms and processes in order such that your data scientists can do what they were hired for. Initially for a data scientist, this is not front of mind when carrying out their daily duties. We will first look at a common problem; customer churn. which is when a customer ends their relationship with your business. We can use this example to roughly approximate the value to the company of improving the prediction of these customers. Throughout the years I’ve come to realise that the idea of a cool model, is just an idea. Being able to show tangible value from investing in that model is what allows you to take it from an idea to implementation.
Following this, we’ll go through a feature engineering example with the well known airline data set, and show the process a data scientist goes through when they’re model building. The point here is to demonstrate one of the main skill sets required to improve a model; creativity, and we’ll do this through a real-life example. Although it will appear to be aimed at a technical audience, I have in mind a more business/IT crowd. Since these are the people who ultimately decide on the platform that a data scientist will deploy their models on. I’m surprised there aren’t more semi-technical articles elucidating the different stages of the analytics value chain.
Demonstrating analytics value with customer churn
For many traditional organisations, there is often much talking about machine learning and data science, but less walking. You may be in a position where there is no preexisting process to have a machine learning model enter a production environment. A conservative IT culture, disinterested senior leaders, a mandate to be innovative – if this is all sounding too familiar to you than read on! Putting a big number on the table is good start, convincing yourself and others that it is achievable is the subject of this article.
So we’ll be using customer churn as an example to demonstrate the value associated with improving a model. This is a central problem for any business with a subscription model – where customers sign up and pay some regular amount. Remember it’s not just the revenue associated with the customer that is lost through churn, it is also the cost associated with marketing and on-boarding. Consider the following:
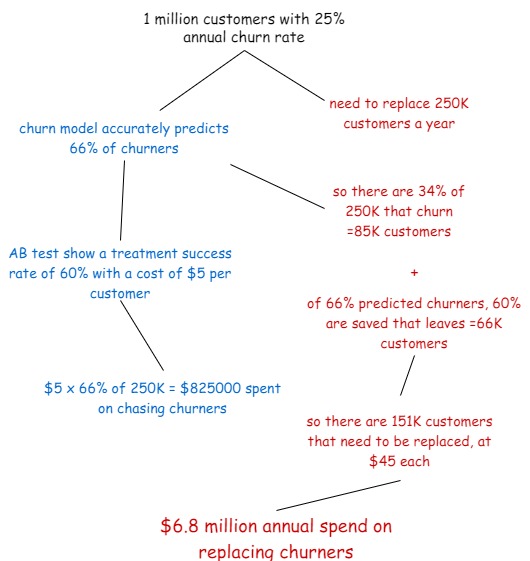
- A company has a rolling window churn model operating at 66% true positive accuracy. This means that 66% of the time, when the model predicts someone will churn over the next 3 months, they do actually churn. We will not concern ourselves with false positive/negatives for now. Let’s do the math:

So we can see that it costs a lot more to acquire a customer than it does retain a customer, this is why companies are interested in churn modelling. A modest improvement in the customer retention rate can greatly affect a company’s bottom line, let’s see what happens when we improve the churn model by 5%
So that’s an annual saving of $650K in this simple example. This is obviously going to be different for every organisation, but mapping out the value of your idea will go a long way in getting top level support, and realising your cool idea. In the next example, we’ll show how you might go about getting that 5% increase in accuracy, and hopefully your performance bonus.
Feature engineering with airline flight delay data
Feature engineering is my favourite part of practising data science, I find it to be a creative exercise that brings real value. Having an inquisitive nature, being happy to fail and move on, and perseverance are key qualities to succeed in inventing new features.
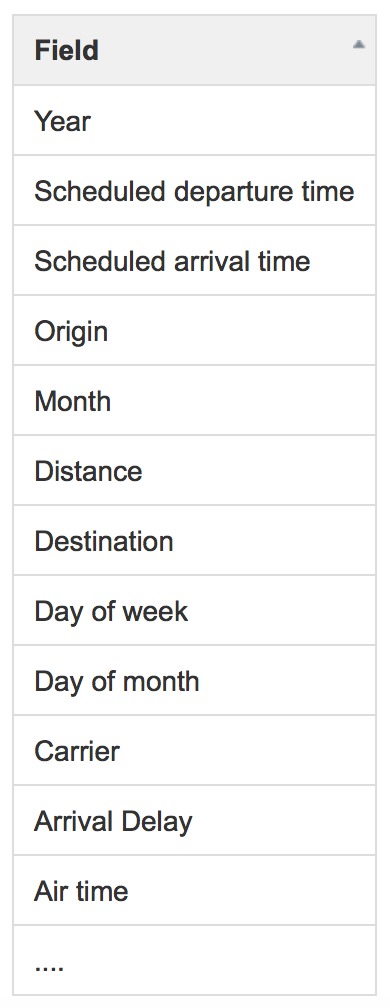
Let’s use the familiar airline flight delay data set as an example, (I’m not going to solve your company’s churn problem in this post 😊). This is a great data set for testing models, platforms and techniques. The data is varied and voluminous, much more so than the Iris or Old Faithful data sets that are commonly used. So what sort of data are we looking at here:

These are all what you would expect from an airline, so I want to build a model that predicts Arrival Delay. We first split our data into a training set for building the model, and a separate test set for evaluating the performance of the model. Since this is a regression type model, we’ll use root mean squared error (RMS error) as our accuracy metric for simplicity, this is just the square root of the mean of the squared differences between the actual and predicted values in our test set. Before we get onto feature engineering, let’s first construct a model ‘as is’, so we have a value in which to benchmark our features against. I’ve found the gradient boosting machine algorithm by h2o.ai to be a reliable and versatile model, and I’ll employ it here. The RMS error of our initial model is 23.7 minutes, let’s see if we can knock off 5%.
There are a lot of easy gets with a data set like this, for example
- convert week days to categorical variables
- The days of the week are not numbers, Tuesday is not twice as much as Monday, and Tuesday multiplied by Wednesday does not equal Saturday. This allows algorithms to place higher importance on certain variables, in this case it might be weekends. Interestingly, these will be converted back to numbers through one-hot encoding, where each category is assigned a column, and when the category occurs there will be a ‘one’ in the corresponding column. Modern algorithms should do this conversion for you.
- convert months/days of month to categorical variables
- See above
- round departure/arrival time to nearest hour and convert to categorical variable
- This one is less obvious, there isn’t much difference between 14:34 and 14:41, so just call it 15:00. And similar to above, 15:00 is not twice 7:50 AM.
Then there are slightly more complex features that will need to be invented
- difference between median number of departures per day.
- This was described in another post; the difference between the median number of daily departures per airport, and scheduled number of departures for each day. So if an airport is expecting a larger than usual number of flights, this will be accounted for by this value
- difference between median number of arrival per day.
- See above, but for arrivals.
- the number of days from a national holiday
- This was a cool feature described in a Hortonworks blog with the same data set; I applied what I believe is the same algorithm but found it made my model slightly less accurate!
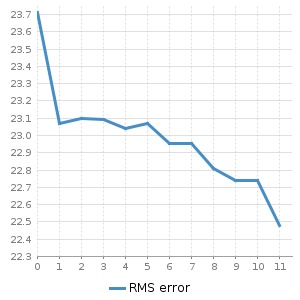
So let’s understand the effect these features have on our flight delay model, I rebuilt and measured the accuracy of the models after adding the feature to the data set. That way, the error can be plotted as a function of features added.

In the figure above, we can see how adding new features we described above contributes to the accuracy of the model. I’ve included some features that have none or negative contribution to the accuracy, this is to give you more of an insight into the process of feature engineering itself; there’s plenty of trial and error involved. Although the contribution from each individual feature is small, they eventually add up. It is certainly the case of quality over quantity, although where you don’t have the former, the latter will do.
And we reached our goal of a 5% decrease in error. Feel free to check my code and play around, it is available on github, try adding features of your own.
Summing up
Demonstrating the value of data science and machine learning is immensely important in order to gain the necessary support to have it implemented, but is typically not the first thing a data scientist will think of when given access to your database. I hope this post will help you or your data scientists measure and map out the value of their ideas. We also looked at the process of feature engineering, what I find to be one of the more enjoyable aspects of my job – and one that can bring real value to an organisation.
